Summary
Income inequality refers to how unevenly income is distributed throughout a population. The less equal the distribution, the greater the income inequality. Income inequality is often accompanied by wealth inequality, which is the uneven distribution of wealth.
- In the ‘About’ section of this post is an overview of the issues or challenges, potential solutions, and web links. Other sections have information on relevant legislation, committees, agencies, programs in addition to information on the judiciary, nonpartisan & partisan organizations, and a wikipedia entry.
- To participate in ongoing forums, ask the post’s curators questions, and make suggestions, scroll to the ‘Discuss’ section at the bottom of each post or select the “comment” icon.
The US Democracy category has related posts on government agencies and departments and committees and their Chairs.
PBS News Hour – 01/06/2024 (16:09:11)
Knowing how to budget and save money are important skills, but not everyone is taught how to do so. Only 25 states require high schoolers to take a personal finance class, and schools with predominantly Black and brown students are less likely to offer those courses. Laura Barrón-López reports on how younger generations are working to improve their financial literacy and help close the wealth gap.
OnAir Post: Income Inequality
News
PBS NewsHour – February 27, 2019 (16:08:22)
https://www.youtube.com/watch?v=oFpidadvTvsEconomic inequality is a major theme in the American political dialogue. As the country’s wealthiest people continually become richer at the expense of the poor, some research suggests they may actually become less happy and healthy. Economics correspondent Paul Solman reports on the nuanced data and the challenges of evaluating a society’s well-being.
Economic inequality is a major theme in the American political dialogue. As the country’s wealthiest people continually become richer at the expense of the poor, some research suggests they may actually become less happy and healthy. Economics correspondent Paul Solman reports on the nuanced data and the challenges of evaluating a society’s well-being.
About
Check the Economy & Jobs post for the party positions, committees, government agencies related to Income Inequality and Economy & Jobs issues.
Problem
Measurement and Data Availability:
- Accurately measuring income inequality can be challenging due to the complexities of income distribution and the availability of reliable data.
- Different income concepts and methodologies can lead to different estimates of inequality.
- Data gaps and limitations can hinder a comprehensive understanding of inequality patterns.
Causes and Drivers:
- Identifying the underlying drivers of income inequality, such as technological advancements, globalization, labor market dynamics, and tax policies, is crucial.
- Understanding the interactions between different factors that contribute to inequality is complex.
Policy Interventions:
- Designing effective policy interventions to address income inequality is multifaceted.
- Balancing social equity with economic growth can be difficult.
- Evaluating the impact of policy measures on inequality and their potential consequences is essential.
Public Perception and Political Will:
- Addressing income inequality requires public support and political consensus.
- Communicating the issue effectively and raising awareness about its consequences is crucial.
- Overcoming resistance to change from those who benefit from current inequalities can be challenging.
Social and Economic Impacts:
- Income inequality can have significant social and economic consequences, including poverty, diminished social mobility, and societal tensions.
- Understanding the long-term effects of inequality on economic growth, social cohesion, and political stability is important.
International Cooperation:
- Income inequality is a global issue that requires international cooperation.
- Sharing best practices, data, and policy approaches across countries can enhance understanding and inform policymaking.
Technological Disruption:
- Technological advancements, such as automation and artificial intelligence, can potentially exacerbate income inequality.
- Identifying mechanisms to mitigate negative impacts and promote inclusive growth is crucial.
Climate Change and Environmental Inequality:
- Climate change and environmental degradation can disproportionately affect low-income populations, leading to increased inequality.
- Addressing this intersectionality and developing sustainable and equitable solutions is essential.
Gender and Racial Disparities:
- Income inequality often intersects with gender and racial disparities.
- Understanding and addressing the specific challenges faced by underrepresented groups is crucial for promoting equity.
Source: Google Search + Gemini + onAir curation
Solutions
Progressive Taxation:
- Implement progressive income taxes, where individuals with higher incomes pay a larger percentage of their earnings.
- Increase taxes on capital gains, wealth, and inheritance.
- Close tax loopholes and deductions that disproportionately benefit the wealthy.
2. Minimum Wage Policies:
- Raise the minimum wage to a living wage that can support a family.
- Tie the minimum wage to inflation to ensure it keeps pace with the cost of living.
3. Social Programs:
- Expand access to affordable healthcare, education, and childcare.
- Provide financial assistance through social welfare programs, such as Earned Income Tax Credit.
- Invest in public infrastructure and job training to create opportunities for low-income individuals.
4. Labor Unionization:
- Support labor unions and collective bargaining rights.
- Encourage the formation of unions in industries with low unionization rates.
- Strengthen labor laws to protect workers from retaliation and discrimination.
5. Corporate Responsibility:
- Promote corporate social responsibility practices, including fair wages, benefits, and workforce diversity.
- Implement policies that encourage companies to disclose their income inequality measures.
- Support employee ownership and profit-sharing schemes.
6. Financial Inclusion:
- Increase access to banking and financial services for low-income individuals.
- Promote financial literacy and education programs.
- Reduce predatory lending and fees that disproportionately impact the poor.
7. Education and Skills Development:
- Improve the quality of education, especially for students from disadvantaged backgrounds.
- Invest in post-secondary education and vocational training.
- Provide lifelong learning opportunities for workers to adapt to changing job markets.
8. Affordable Housing:
- Increase the supply of affordable housing units.
- Provide financial assistance to low-income families for rent or mortgage payments.
- Implement policies to prevent discrimination in housing.
9. Community Development:
- Invest in community development initiatives that address the underlying causes of income inequality, such as poverty, crime, and lack of opportunity.
- Support job creation and entrepreneurial opportunities in low-income communities.
10. Political Representation:
- Promote inclusive political representation that ensures the voices of low- and middle-income individuals are heard.
- Implement campaign finance reforms to reduce the influence of wealthy donors.
- Establish independent commissions to draw electoral boundaries and ensure fair representation.
Source: Google Search + Gemini + onAir curation
Websites
Government Agencies and International Organizations:
- Organization for Economic Cooperation and Development (OECD): https://www.oecd.org/
- International Monetary Fund (IMF): https://www.imf.org/
- World Bank: https://www.worldbank.org/
- Economic Policy Institute: https://www.epi.org/
- Center on Budget and Policy Priorities: https://www.cbpp.org/
Non-profit Organizations and Think Tanks:
- Brookings Institution: https://www.brookings.edu/topics/inequality/
- Institute for Policy Studies: https://www.ips-dc.org/
- Oxfam International: https://www.oxfam.org/en/
- Piketty for Justice, Equality, and Human Progress: https://piketty.pse.ens.fr/
- World Inequality Lab: https://wirlab.org/
Research Institutions and Universities:
- Paris School of Economics: https://www.parisschoolofeconomics.eu/
- Princeton University Inequality Research Lab: https://pirp.princeton.edu/
- London School of Economics and Political Science (LSE): https://www.lse.ac.uk/
- University of California, Berkeley, Center for Equitable Growth: https://equitablegrowth.org/
- University of Oxford, Inequality and Poverty Research Center: https://www.qeh.ox.ac.uk/
Advocacy Groups and Campaigns:
- Fight for $15: https://fightfor15.org/
- Tax Justice Network: https://taxjustice.net/
- Global Alliance for Tax Justice: https://www.globaltaxjustice.org/
- Oxfam America’s Fight Poverty, Here and Now campaign: https://www.oxfamamerica.org/explore/what-we-do/fight-poverty-here-and-now
- ActionAid USA: https://actionaid.org/
Source: Google Search + Gemini + onAir curation
Web Links
Legislation
Laws
. Earned Income Tax Credit (EITC)
- Provides a refundable tax credit to low- and moderate-income working individuals and families.
- Helps offset the payroll tax burden, reducing income inequality.
2. Child Tax Credit (CTC)
- Offers a tax credit for each qualifying child under the age of 17.
- Provides financial support to families with children, reducing child poverty and income inequality.
3. Supplemental Nutrition Assistance Program (SNAP)
- Provides food assistance to low-income individuals and families.
- Improves access to nutritious food, reducing food insecurity and improving overall health outcomes.
4. Medicaid
- Provides health insurance coverage to low-income individuals and families.
- Expands access to healthcare, reducing poverty and income inequality related to healthcare costs.
5. Supplemental Security Income (SSI)
- Provides a monthly cash benefit to low-income elderly, disabled, and blind individuals.
- Helps ensure a basic level of income for individuals with limited earning capacity.
6. Unemployment Insurance
- Provides temporary financial assistance to individuals who have lost their jobs.
- Helps mitigate income loss and prevents individuals from falling into poverty.
7. Affordable Care Act (ACA)
- Expanded health insurance coverage to millions of Americans.
- Reduced the number of uninsured individuals, improving overall health outcomes and reducing income inequality associated with healthcare costs.
8. Tax Cuts and Jobs Act of 2017 (TCJA)
- Included provisions that disproportionately benefited high-income earners.
- This law has been criticized for exacerbating income inequality. However, it also reduced taxes for low- and moderate-income families.
9. American Rescue Plan Act of 2021 (ARPA)
- Provided temporary financial assistance and stimulus measures during the COVID-19 pandemic.
- Included provisions such as the expanded CTC and EITC, which helped reduce income inequality.
10. Build Back Better Act (BBB)
- A proposed legislative package that would invest in social programs and address climate change.
- Includes provisions such as expanding access to affordable childcare and eldercare, which can reduce income inequality by increasing the workforce participation of women and caregivers.
New Bills
Sampling of Bills:
H.R.953 — Child Care for Every Community Act
Sponsor: Sherrill, Mikie [Rep.-D-NJ-11] (Introduced 02/09/2023)
Cosponsors: (90)
Committees: House – Education and the Workforce
Latest Action: House – 02/09/2023 Referred to the House Committee on Education and the Workforce. (All Actions)
S.1698 — Affordability is Access Act of 2023
Sponsor: Murray, Patty [Sen.-D-WA] (Introduced 05/18/2023)
Cosponsors: (32)
Committees: Senate – Health, Education, Labor, and Pensions
Latest Action: Senate – 05/18/2023 Read twice and referred to the Committee on Health, Education, Labor, and Pensions. (All Actions)
H.R.3239 — )Advancing Equity Through the Arts and Humanities Act of 2023
Sponsor: Lee, Barbara [Rep.-D-CA-12] (Introduced 05/11/2023)
Cosponsors: (19)
Committees: House – Education and the Workforce
Latest Action: House – 05/11/2023 Referred to the House Committee on Education and the Workforce. (All Actions)
H.R.3068 — Equal Health Care for All Act
Sponsor: Schiff, Adam B. [Rep.-D-CA-30] (Introduced 05/02/2023)
Cosponsors: (21)
Committees: House – Energy and Commerce; Ways and Means
Latest Action: House – 05/05/2023 Referred to the Subcommittee on Health. (All Actions)
H.R.1708 — 118th Congress (2023-2024)Housing Is a Human Right Act of 2023
Sponsor: Jayapal, Pramila [Rep.-D-WA-7] (Introduced 03/22/2023)
Cosponsors: (25)
Committees: House – Financial Services; House Administration; Judiciary; Education and the Workforce; Ways and Means
Latest Action: House – 03/22/2023 Referred to the Committee on Financial Services, and in addition to the Committees on House Administration, the Judiciary, Education and the Workforce, and Ways and Means, for a period to be subsequently determined by the Speaker, in each case for consideration of… (All Actions)
H.R.4979 — Fairness for Small-Scale Farmers and Ranchers Act
Sponsor: Casar, Greg [Rep.-D-TX-35] (Introduced 07/27/2023)
Cosponsors: (19)
Committees: House – Agriculture; Judiciary
Latest Action: House – 07/27/2023 Referred to the Committee on Agriculture, and in addition to the Committee on the Judiciary, for a period to be subsequently determined by the Speaker, in each case for consideration of such provisions as fall within the jurisdiction of the committee concerned. (All Actions)
COMMITTEES, AGENCIES, & PROGRAMS
Committees
Source: Google Search + Gemini + onAir curation
House of Representatives
- House Ways and Means Committee: Responsible for tax policy, trade, and Social Security.
- House Education and Labor Committee: Oversees workforce development, education, and minimum wage.
- House Committee on Oversight and Reform: Investigates government spending and efficiency, including programs aimed at addressing income inequality.
Senate
- Senate Finance Committee: Handles tax policy, trade, and Social Security.
- Senate Health, Education, Labor, and Pensions (HELP) Committee: Addresses healthcare, education, workforce development, and minimum wage.
- Senate Homeland Security and Governmental Affairs Committee: Deals with government spending, efficiency, and anti-fraud measures in government programs.
Joint Committees
- Joint Economic Committee: Studies economic issues, including income inequality and workforce trends.
- Joint Committee on Taxation: Provides nonpartisan analysis of tax policy, including its impact on income inequality.
Other Relevant Subcommittees
- House Budget Committee (Income Inequality Task Force): Monitors and analyzes income inequality trends.
- Senate Budget Committee (Subcommittee on Economic Growth, Job Creation, and Family Security): Addresses workforce development, education, and other factors related to income inequality.
These committees and subcommittees play a crucial role in shaping legislation, conducting hearings, and overseeing government programs that aim to address income inequality challenges.
Government Agencies
Source: Google Search + Gemini + onAir curation
Executive Branch
- Department of Treasury:
- Administers tax policies and regulations that can impact income inequality.
- Department of Labor:
- Enforces labor laws that protect workers’ rights and promote fair wages.
- Department of Housing and Urban Development (HUD):
- Provides affordable housing programs and supports initiatives to address income disparities.
- Department of Health and Human Services (HHS):
- Administers healthcare and social welfare programs that can mitigate income inequality.
Legislative Branch
- House Committee on Ways and Means:
- Responsible for drafting tax legislation that can address income disparities.
- Senate Committee on Finance:
- Similar to the House Ways and Means Committee, but with jurisdiction over tax legislation in the Senate.
- House Committee on Education and Labor:
- Oversees policies related to workforce development and education, which can impact income inequality.
Independent Agencies
- Federal Reserve System:
- Monetary policy decisions can have implications for income inequality, such as raising interest rates to address inflation.
- Congressional Budget Office (CBO):
- Provides nonpartisan budget analysis and economic projections, including data on income inequality.
- Government Accountability Office (GAO):
- Investigates and reports on government programs and policies, including those related to income inequality.
Other Key Entities
- Office of Management and Budget (OMB):
- Develops the President’s budget proposal, which can include initiatives to address income inequality.
- Council of Economic Advisers:
- Advises the President on economic policy, including issues related to income inequality.
Programs & Initiatives
Source: Google Search + Gemini + onAir curation
. Earned Income Tax Credit (EITC)
- Provides tax credits to low- and moderate-income working families.
- Reduces the after-tax cost of working, boosting incomes and incentivizing employment.
2. Child Tax Credit (CTC)
- Provides tax credits for parents and guardians of qualifying children.
- Supports families with children, reducing child poverty and promoting economic security.
3. Pell Grants
- Provides financial aid to low-income students pursuing higher education.
- Increases access to education, which enhances earning potential and reduces income inequality.
4. Supplemental Nutrition Assistance Program (SNAP)
- Provides food assistance to low-income individuals and families.
- Addresses food insecurity, improving health outcomes and reducing economic hardship.
5. Affordable Care Act (ACA)
- Expands health insurance coverage to millions of Americans.
- Reduces the financial burden of healthcare, freeing up income for other essential expenses.
6. Fair Labor Standards Act (FLSA)
- Sets a minimum wage and overtime pay rules.
- Protects workers from exploitation and ensures a fair income for their labor.
7. Family and Medical Leave Act (FMLA)
- Provides job-protected leave for certain family and medical reasons.
- Allows employees to balance work and family, reducing income disruptions due to caregiving responsibilities.
8. Labor Unions
- Advocate for higher wages, benefits, and working conditions for their members.
- Promote income equality by strengthening the bargaining power of workers.
9. Community Development Block Grants (CDBG)
- Provides funding for community-driven economic development projects.
- Supports job creation, affordable housing, infrastructure improvements, and other initiatives that address income inequality at the local level.
10. Invest in America Act
- Proposed legislation that includes substantial investments in infrastructure, education, and clean energy.
- Aims to create jobs, enhance workforce training, and reduce income inequality by addressing systemic barriers.
Advancing Equity and Racial Justice Through the Federal Government
Source: White House
EXECUTIVE ORDER 13985
“It is therefore the policy of my Administration that the Federal Government should pursue a comprehensive approach to advancing equity for all, including people of color and others who have been historically underserved, marginalized, and adversely affected by persistent poverty and inequality. Affirmatively advancing equity, civil rights, racial justice, and equal opportunity is the responsibility of the whole of our Government.”
More Information
Judiciary
Source: Google Search + Bard AI
The relationship between income inequality and the judiciary is a complex and multifaceted issue with significant implications for the justice system. Here are some key points to consider:
1. Access to Justice
- Financial Barriers: Income inequality can directly impact access to justice. Legal services can be expensive, including attorney fees, court costs, and filing fees. Individuals from lower-income backgrounds may struggle to afford these costs, leading to unequal treatment before the law.
- Pro Bono Services: While pro bono work by attorneys can help mitigate some of these issues, it cannot address the systemic problem. A more equitable system requires broader access to affordable legal representation.
2. Judicial Bias
- Implicit Bias: Income inequality can contribute to implicit biases among judges. Studies have shown that individuals from lower socioeconomic backgrounds may be perceived differently in court, potentially leading to harsher sentences or less favorable rulings.
- Economic Ties: In some cases, judges may have economic ties to wealthy individuals or corporations, which could potentially influence their decisions in ways that benefit the affluent.
3. Legislative Influence
- Lobbying Efforts: Wealthy individuals and corporations have greater resources to influence legislation that affects the judiciary. This can include lobbying for laws that benefit their interests, such as tax breaks or deregulation.
- Campaign Contributions: Large campaign donations can give wealthy individuals and corporations significant influence over judicial elections, potentially leading to the appointment of judges who are more sympathetic to their interests.
4. Public Perception
- Erosion of Trust: Income inequality can erode public trust in the judiciary. When people perceive the justice system as favoring the wealthy, it can undermine their faith in the rule of law.
5. Potential Reforms
- Legal Aid Programs: Expanding access to legal aid programs can help level the playing field by providing affordable legal representation to low-income individuals.
- Judicial Ethics Reforms: Implementing stricter judicial ethics rules can help prevent conflicts of interest and ensure that judges are making decisions based solely on the law.
- Campaign Finance Reform: Limiting the influence of money in judicial elections can help ensure that judges are elected based on their qualifications and not their ability to raise funds.
- Public Education: Educating the public about the justice system and how it works can help foster a better understanding of the issues and promote greater trust in the judiciary.
Addressing the relationship between income inequality and the judiciary requires a multifaceted approach that involves both systemic reforms and increased public awareness. By promoting access to justice, preventing judicial bias, and ensuring that the justice system is fair and impartial, we can help create a more equitable and just society for all.
Nonpartisan Organizations
Source: Google Search + Gemini + onAir curation
Policy Research Organizations:
- Brookings Institution: Focuses on economic, social, and foreign policy issues, including income inequality.
- Center on Budget and Policy Priorities: Analyzes federal budget and tax policies, with a focus on their impact on low- and moderate-income Americans.
- Economic Policy Institute: Conducts research on economic issues affecting working families, including income inequality.
- Institute for Policy Studies: A progressive think tank that promotes economic and social justice, including addressing income inequality.
- Urban Institute: Conducts research on urban issues, including poverty, inequality, and workforce development.
Advocacy Organizations:
- American Civil Liberties Union (ACLU): Advocates for civil rights and economic justice, including addressing income inequality.
- American Federation of Labor and Congress of Industrial Organizations (AFL-CIO): The largest union federation in the US, representing workers from all sectors and advocating for policies that promote economic equality.
- Center for American Progress: A progressive advocacy organization that promotes policies to address income inequality, among other social issues.
- Economic Justice Center: A non-profit organization that provides legal and policy advocacy for low-income individuals and families.
- National Employment Law Project: Advocates for workers’ rights and economic justice, including policies to reduce income inequality.
Government Accountability and Oversight Organizations:
- Congressional Budget Office (CBO): Provides nonpartisan analysis of the federal budget and economic policies.
- Government Accountability Office (GAO): Investigates government programs and operations, including those related to income inequality.
- National Taxpayers Union: Advocates for lower taxes and smaller government, with a focus on tax policies that promote economic fairness.
- Sunlight Foundation: Focuses on transparency and accountability in government, including policies affecting income inequality.
Other Key Organizations:
- Fight for 15: A campaign to raise the minimum wage to $15 per hour.
- Institute for the Study of Inequality: Conducts research and education on income inequality and its impact on society.
- National Low Income Housing Coalition: Advocates for affordable housing policies to reduce income inequality.
Partisan Organizations
Source: Google Search + Gemini + onAir curation
Democratic Organizations:
- Center on Budget and Policy Priorities: Conducts research and advocates for policies to reduce poverty and inequality, including expanding access to affordable housing, healthcare, and education.
- Economic Policy Institute: Researches and promotes policies that support working families and reduce income disparity, such as raising the minimum wage, strengthening unions, and investing in education.
- Demos: A public policy organization that focuses on advancing social justice and economic equity through research, advocacy, and activism.
- National Employment Law Project: A non-profit organization that advocates for policies that protect the rights of low-wage workers and promote economic opportunity.
- Center for American Progress: A think tank that conducts research and advocates for progressive policies, including addressing income inequality and expanding economic opportunity.
Republican Organizations:
- American Enterprise Institute: A conservative think tank that conducts research and promotes policies aimed at promoting economic growth and individual liberty, including reducing government intervention and taxes that may exacerbate income inequality.
- Heritage Foundation: A conservative think tank that focuses on free market policies and limited government. Its research and advocacy often address income inequality from the perspective of individual responsibility and free choice.
- Manhattan Institute for Policy Research: A libertarian think tank that conducts research and promotes policies aimed at reducing government intervention and promoting individual freedom. Its stance on income inequality often emphasizes the role of personal responsibility and free markets.
- Hoover Institution: A conservative think tank that focuses on promoting economic growth, national security, and individual liberty. Its research and policy recommendations often favor market-based solutions to address income inequality.
- ** Cato Institute:** A libertarian think tank that advocates for limited government, free markets, and individual rights. Its research and advocacy often cast income inequality as a natural consequence of free market competition and individual choice.
“Income inequality in the US” (Wiki)

| This article is part of a series on |
| Income in the United States |
|---|
 |
 United States portal United States portal |
Income inequality has fluctuated considerably in the United States since measurements began around 1915, moving in an arc between peaks in the 1920s and 2000s, with a lower level of inequality from approximately 1950-1980 (a period named the Great Compression), followed by increasing inequality, in what has been coined as the great divergence.
The U.S. has the highest level of income inequality among its (post-industrialized) peers.[1] When measured for all households, U.S. income inequality is comparable to other developed countries before taxes and transfers, but is among the highest after taxes and transfers, meaning the U.S. shifts relatively less income from higher income households to lower income households. In 2016, average market income was $15,600 for the lowest quintile and $280,300 for the highest quintile. The degree of inequality accelerated within the top quintile, with the top 1% at $1.8 million, approximately 30 times the $59,300 income of the middle quintile.[2]
The economic and political impacts of inequality may include slower GDP growth, reduced income mobility, higher poverty rates, greater use of household debt, leading to an increased risk of financial crises, and political polarization.[3][4] Causes of inequality may include executive compensation increasing relative to the average worker, financialization, greater industry concentration, lower unionization rates, lower effective tax rates on higher incomes, and technology changes that reward higher educational attainment.[5]
Measurement is debated, as inequality measures vary significantly, for example, across datasets[6][7] or whether the measurement is taken based on cash compensation (market income) or after taxes and transfer payments. The Gini coefficient is a widely accepted statistic that allows comparisons across jurisdictions, with 0 indicating perfect equality and 1 indicating maximum inequality. Further, various public and private data sets measure those incomes, e.g., from the Congressional Budget Office (CBO),[2] the Internal Revenue Service, and Census.[8] According to the Census Bureau, income inequality reached then record levels in 2018, with a Gini of 0.485,[9] Since then the Census Bureau have given values of 0.488 in 2020 and 0.494 in 2021, per pre-tax money income.[10]
U.S. tax and transfer policies are progressive and therefore reduce effective income inequality, as rates of tax generally increase as taxable income increases. As a group, the lowest earning workers, especially those with dependents, pay no income taxes and may actually receive a small subsidy from the federal government (from child credits and the Earned Income Tax Credit).[11] The 2016 U.S. Gini coefficient was .59 based on market income; it was reduced to .42 after taxes and transfers, according to Congressional Budget Office (CBO) figures. The top 1% share of market income rose from 9.6% in 1979 to a peak of 20.7% in 2007, before falling to 17.5% by 2016. After taxes and transfers, these figures were 7.4%, 16.6%, and 12.5%, respectively.[2]
Definitions


Finally, in 2023, the steepness of the curve decreased (red line).

Income distribution can be assessed using a variety of income definitions. Adjustments are applied for various reasons, particularly to better reflect the actual economic resources available to a given individual/household.
- Market income—Labor income; business income; capital income (including capital gains); income received in retirement for past services; and other non-governmental sources of income[2]
- Income before taxes and transfers (IBTT)—market income plus social insurance benefits (including benefits from Social Security, Medicare, unemployment insurance, and workers’ compensation)[2]
- Adjusted compensation or income after taxes and transfers—IBTT plus employee benefits and transfers such as housing subsidies, minus taxes
- Gini coefficient—Summarizes income distribution. It uses a scale from 0 to 1. Zero represents perfect equality (everyone having the same income), while 1 represents perfect inequality (one person receiving all the income). (Index scores are commonly multiplied by 100.)[13]
The CBO explains the Gini as “A standard composite measure of income inequality is the Gini coefficient, which summarizes an entire distribution in a single number that ranges from zero to one. A value of zero indicates complete equality (for example, if each household received the same amount of income), and a value of one indicates complete inequality (for example, if a single household received all the income). Thus, a Gini coefficient that increases over time indicates rising income inequality.”
“The Gini coefficient can also be interpreted as a measure of one-half of the average difference in income between every pair of households in the population, divided by the average income of the total population. For example, the Gini coefficient of 0.513 for 2016 indicates that the average difference in income between pairs of households in that year was equal to 102.6 percent (twice 0.513) of the average household income in 2016, or about $70,700 (adjusted for differences in household size). Similarly, the Gini coefficient of 0.521 projected for 2021 indicates that the average difference in income between pairs of households would equal 104.2 percent (twice 0.521) of average household income in 2021, or about $77,800 (in 2016 dollars).”[14]: 22-24


History
Income inequality has fluctuated considerably since measurements began around 1915, declining between peaks in the 1920s and 2007 (CBO data[2]) or 2012 (Piketty, Saez, Zucman data[15]). Inequality steadily increased from around 1979 to 2007, with a small reduction through 2016,[2][16][17] followed by an increase from 2016 to 2018.[18]
Before the 20th century
In the late 18th century, “incomes were more equally distributed in colonial America than in any other place that can be measured,” according to Peter Lindert and Jeffrey Williamson. The richest 1 percent of households held only 8.5% of total income in the late 18th century. Some reasons for this include the ease with which the average American could buy frontier land, which was abundant at the time, and an overall scarcity of labor in non-slaveholding areas, which forced landowners to pay higher wages. There were also relatively few poor people in America at the time, since only those with at least some money could afford to come.[19]
In 1860, the top 1 percent collected almost one-third of property incomes, as compared to 13.7% in 1774. There was intense competition for land in cities and non-frontier areas during this period, with those who had already acquired land becoming richer than everyone else. The burgeoning financial sector also greatly rewarded the already-wealthy, as they were the only ones financially sound enough to invest.[19]
1913–1941
An early governmental measure that slightly reduced inequality was the enactment of the first income tax in 1913. The 1918 household Gini coefficient (excluding capital gains) was 40.8. A brief but sharp depression in 1920-1921 reduced incomes. Income inequality rose from 1913, peaking in 1926 (1928 Gini 48.9, 1936 Gini 45.5) and 1941 (Gini 43.1), after which wartime measures of the Roosevelt administration began to equalize the income distribution.[20] Social Security was enacted in 1935. At several points in this pre-World War II era, in which the Rockefellers and the Carnegies dominated American industry, the richest 1% of Americans earned over 20% of the income share.[8]
Great Compression (1937–1967)

From about 1937 to 1947, a period dubbed as the “Great Compression“,[21] income inequality fell dramatically. The GINI fell into the high 30s.[20] Progressive New Deal taxation, stronger unions, strong post-war economic growth and regulation by the National War Labor Board broadly raised market incomes and lowered the after-tax incomes of top earners.[22]: 47–52 In the 1950s, marginal tax rates reached 91%, although the top 1% paid only about 16% in income taxes.[23] Tax cuts in 1964 lowered marginal rates and closed loopholes. Medicare and Medicaid were enacted in 1965. The Earned Income Tax Credit was enacted in 1975.
The income change was the product of relatively high wages for trade union workers, lack of foreign manufacturing competition, and political support for redistributive government policies. By 1947, more than a third of non-farm workers were union members.[22]: 49 Unions both raised average wages for their membership, and indirectly, and to a lesser extent, raised wages for non-union workers in similar occupations.[22]: 51 Economist Paul Krugman claimed that political support for equalizing government policies was provided by high voter turnout from union voting drives, Southern support for the New Deal, and prestige that the massive mobilization and victory of World War II had given the government.[22]: 52, 64, 66
A 2022 study in the Economic Journal challenged the view that World War II was a great leveler of income inequality. The study points instead to a gradual decline in income inequality during the Great Depression, which extended into the war years.[24]
1979–2007 increase

2007–2016 reduction
CBO
The household income Gini index for the United States was 45.6 in 2009 and 45.4 in 2015, indicating a reduction in inequality during that period.[20] CBO reported that the share of after-tax income received by the top 1% peaked in 2007 at 16.6%. It fell to 11.3% in 2009, due in part to the impact of the Great Recession on investment income, then increased thereafter to 14.9% by 2012 as the economy recovered. It then fell somewhat, reaching 12.5% by 2016, reflecting Obama policies, including the expiration of the Bush tax cuts for top incomes, and both tax increases on top incomes and redistribution to lower-income groups under the Affordable Care Act.[2]
CBO reported that for the 1979-2016 period, after-tax income (adjusted for inflation) of households in the top 1 percent grew by 226%, compared to 65% for the 81st to 90th percentiles, 47% for the 20th to 80th percentiles, and 85% for the bottom fifth. The income growth for the top 1% was lower than during 1979-2007, while the bottom fifth experienced much higher growth, indicating a reduction in inequality from 2007 to 2016. The bottom quintile benefited from Medicaid expansion and refundable tax credits.[2]
Saez, et al.


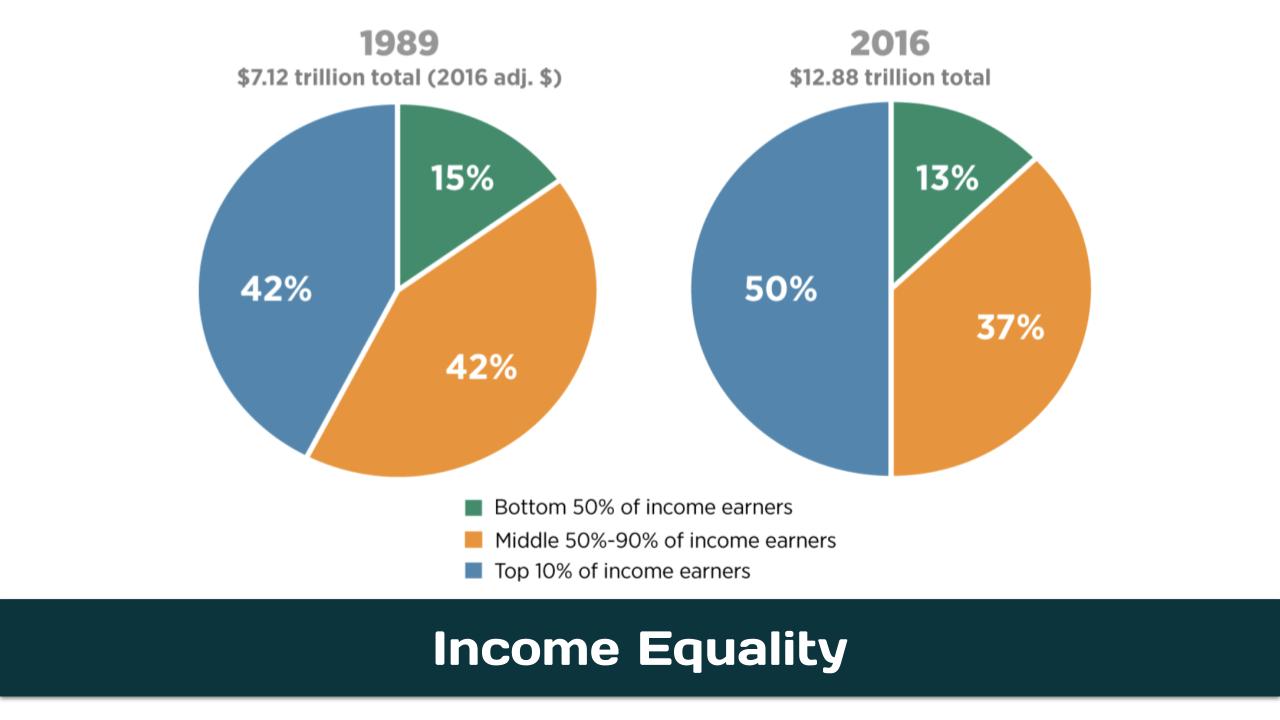
The top 1% earned 12% of market income in 1979, 20% in 2007, and 19% in 2016. For the bottom 50%, these figures were 20%, 14% and 13%, respectively. For the middle 40% group, a proxy for the middle class, these figures were 45%, 41%, and 41%, respectively.[15] Measured by the share captured by the top 1%, by 2012, post-Great Recession market income inequality was as high as it was during the Roaring Twenties, at just over 20%.[48][15]
The Great Recession took place from December 2007 to June 2009.[49] From 2007 to 2010, total income going to the bottom 99 percent of Americans declined by 11.6%, while the top 1% fell by 36.3%.
In 2014, Saez and Gabriel Zucman reported that more than half of those in the top 1 percent had not experienced relative gains in wealth between 1960 and 2012. In fact, those between the top 1% and top .5% had lost relative wealth. Only those in the top .1% and above had made relative wealth gains during that time.[50] Saez reported in 2013 that, from 2009 to 2012, the incomes of the top 1% grew by 31.4%, while the incomes of the bottom 99% grew by 0.4%.[51]
In May 2017, they reported that income shares for those in the bottom half stagnated and declined from 1980 to 2014. Their share declined from 20% in 1980 to 12% in 2014, while the top 1% share rose from 12% in 1980 to 20% in 2014. The top 1% then made, on average, 81 times as much as the bottom 50%, while in 1981 they made 27 times as much. They attributed the growth in inequality from the 1970s to the 1990s to wage growth among top earners, and to investment income widening the gap.[52][53]
Events
The Great Recession lasted from 2008 to 2009, multiplying unemployment and crashing the stock market. Obama administration policies addressed inequality in three main ways, contributing to a reduction in the share of income going to the top 1% measured between 2007 and 2016, both pre-tax and after-tax:
- Tax increases on top incomes. The Bush tax cuts were extended only to the bottom 98-99% of income earners in 2013. CBO reported that the average federal tax rate on the top 1% increased from 28.6% in 2012 to 33.6% in 2013–2014, and remained at 33.3% in 2015–2016.[2]
- The Affordable Care Act. CBO estimated the ACA shifted approximately $21,000 in after-tax income from the average top 1% household via the investment income tax and the Medicare tax, to provide $600 in health insurance subsidies to the average bottom 40% household via insurance subsidies and expanded Medicaid.[54] The Medicaid and CHIPs expansions amounted to 80% of the increase in means-tested transfers between 1979 and 2016.[29]
- Anti-poverty programs. The Supplemental Nutrition Assistance Program (food stamps) and unemployment insurance were expanded.[55]
Post-2016 increase

In 2017, the Tax Cuts and Jobs Act of 2017 reduced personal and corporate income tax rates, which critics said would increase income inequality.[57]
Also in 2017, Forbes found that just three individuals (Jeff Bezos, Warren Buffett, and Bill Gates) held more wealth than the bottom half of the population.[58]
In 2018, and for the first time in U.S. history, U.S. billionaires paid a lower effective tax rate than the working class. A study found that the average effective tax rate paid by the richest 400 families in the country was 23 percent, a full percentage point lower than the 24.2 percent rate paid by the bottom half of American households.[59][60]
In September 2019, the Census Bureau reported that income inequality in the United States had reached its highest level in 50 years, with the GINI index increasing from 48.2 in 2017 to 48.5 in 2018.[61]
In December 2019, the CBO forecast that inequality would increase between 2016 and 2021. Their report had several conclusions: (Adjusted for inflation)
- Before taxes and transfers, all income groups will see income growth, with the largest increases being for the highest and lowest quintiles. After taxes and transfers, that income growth is more skewed toward the higher-income households.[14]: 0
- The ratio of means-tested transfers (aid for people experiencing poverty) to income (BTT) will decrease, mainly because of income growth at the bottom of the distribution, which makes those households ineligible for transfers.[14]: 0
- Lower federal taxes for all income groups, with the greatest decrease for the highest income households, predominantly because of the Trump tax cuts.[14]: 0
- Income inequality is projected to increase, both before taxes and transfers, and after taxes and transfers, from Ginis of .513 to .521 and .423 to .437, respectively. [14]: 0,22-24 [14]
According to a December 2020 analysis of W-2 earnings data from the Economic Policy Institute U.S. income inequality is worsening, as the earnings of the top 1% nearly doubled from 7.3% in 1979 to 13.2% in 2019 while over the same time period the average annual wages for the bottom 90% have stayed within the $30,000 range, increasing from $30,880 to $38,923, representing 69.8% of total earnings in 1979 and 60.9% in 2019 respectively. The earnings of the top 0.1% surged from $648,725 in 1979 to nearly $2.9 million in 2019, an increase of 345%.[63][64]
The Institute for Policy Studies calculated that the average CEO/worker pay ratio of “Low-Wage 100” firms widened from 560:1 in 2019 to 632:1 in 2024.[65] The extreme case was Starbucks, which had a 6,666:1 pay gap in 2024, its CEO receiving $95.8 million.[65] Average CEO compensation within this category of companies was $17.2 million in 2024, while the median worker pay was $35,570.[65]
Causes


According to CBO (and others), the precise reasons for the [recent] rapid growth in income at the top are not well understood”,[27]: xi [70] but involved multiple, possibly conflicting, factors.[71][27]: xi [72]
Causes include:
- decline of labor unions – Unions weakened in part due to globalization and automation may account for one-third to more than one-half of the rise of inequality among men. Pressure on employers to increase wages and on lawmakers to enact worker-friendly measures declined. Rewards from productivity gains went to executives, investors, and creditors.[73][74][75][76][77] A study by Kristal and Cohen reported that rising wage inequality was driven more by declining unions and the fall in the real value of the minimum wage, with twice as much impact as technology.[78] An alternative theory states that passthrough income’s contribution is incorrectly attributed to capital rather than labor.[29]
- globalization – Low-skilled American workers lost ground in the face of competition from low-wage workers in Asia and other “emerging” economies.[79][80] However, surveys of American Economic Association (AEA) members in 2000, 2011, and 2020 showed that consistent majorities of professional economists in the United States disagreed with the statement: “The increasing inequality in the distribution of income in the U.S. is due primarily to the benefits and pressures of a global economy.”[81][82][83]
- skill-biased technological change – Rapid progress in information technology increased the demand for skilled and educated workers.[79]
- superstars – Modern communication technologies often turn competition into a “winner take most” tournament in which the winner is richly rewarded, while the runners-up get far less.[79][84]
- financialization – The increased financialization of the economy starting in the 1970s, according to Marie Gottschalk, “facilitated an astounding upward redistribution of wealth and political power.”[36] In the 1990s stock market capitalization rose from 55% to 155% of Gross Domestic Product (GDP).[85] Corporations began to shift executive compensation toward stock options, increasing incentives for managers to make decisions to increase share prices. Average annual CEO options increased from $500,000 to over $3 million. Stock comprised almost 50% of CEO compensation.[86] Managers were incentivized to increase shareholder wealth rather than to improve long-term contracts with workers; between 2000 and 2007, nearly 75% of increased stock growth came at the cost of labor wages and salaries.[87]
- immigration of less-educated workers – Relatively high levels of immigration of low-skilled workers since 1965 may have reduced wages for American-born high school dropouts;[88]
- college premium – Workers with college degrees traditionally earned more and faced a lower unemployment rate than others.[89] Wealthy families are also more likely to send their children to schools that have large endowments, resulting in more grants and lower student debt. The cycle is completed when wealthier alums donate more, disproportionately increasing the size of elite endowments. Elite colleges also have better access to financial expertise.[90]
- automation – The Bureau of Labor Statistics (BLS) found that increased automation had led to “an overall drop in the need for labor input. This would cause capital share to increase, relative to labor share, as machines replace some workers.”[91]
We haven’t achieved the minimalist state that libertarians advocate. What we’ve achieved is a state too constrained to provide the public goods – investments in infrastructure, technology, and education – that would make for a vibrant economy and too weak to engage in the redistribution that is needed to create a fair society. But we have a state that is still large enough and distorted enough that it can provide a bounty of gifts to the wealthy.
- policy – Critics have argued that neoliberal policies have increased economic inequality[93][94][95] and exacerbated global poverty.[96][97][98] According to Krugman, movement conservatives increased their influence over the Republican Party beginning in the 1970s. In the same era, it increased its political power. The result was less progressive tax laws, anti-labor policies, and slower expansion of the welfare state relative to other developed nations (e.g., the unique absence of universal healthcare).[22] Further, variation in income inequality across developed countries indicates that policy has a significant influence on inequality; Japan, Sweden, and France have income inequality around 1960 levels.[clarification needed][99] The US was an early adopter of neoliberalism, which shifted the distribution of income from labor to capital,[100] and whose focus on growth over equality spread to other countries over time.[101][102] Nevertheless, the United States remains, according to Jonathan Hopkin, “the most extreme case of the subjection of society to the brute force of the market.” As such, he argues that this made the United States an outlier, with economic inequality reaching “unprecedented levels for the rich democracies.”[103] The Center for Economic and Policy Research’s (CEPR) Dean Baker argued in 2006 that the driving force behind rising inequality in the United States has been a series of deliberate neoliberal policy choices, including anti-inflationary bias, anti-unionism and profiteering in the healthcare industry.[104] The economists David Howell and Mamadou Diallo contend that neoliberal policies have contributed to a United States economy in which 30% of workers earn low wages (less than two-thirds the median wage for full-time workers) and 35% of the labor force is underemployed while only 40% of the working-age population in the country is adequately employed.[105]
- corporatism[106] and corpocracy[107][108] – Excessive attention to the interests of corporations reduced scrutiny over compensation shifts.[109]
- female labor force participation – High-earning households are more likely to be dual-earner households.[110]
- stock ownership is tilted towards households at higher income and education levels, resulting in disparate investment income.[111]
- household structure – increase in single-headed households and increase of assortive mating – single-headed households have increased from 15% of households in the late 1980’s to 20% in the mid-2000’s; during that same timeframe, couples where both partners work and whose individual earnings are in the same or neighbouring earnings deciles increased from 33% to 40%. (High-income earners are more likely to marry a high-earning spouse, and low earners are more likely to marry a low-earning spouse.)[112]
Higher-income households are disproportionately likely to prosper when economic times are good, and to suffer losses during downturns. More of their income comes from relatively volatile capital income. For example, in 2011, the top 1% of income earners derived 37% of their income from labor, versus 62% for the middle quintile. The top 1% derived 58% of their income from capital, compared with 4% for the middle quintile. Government transfers accounted for only 1% of the income of the top 1% but 25% of the middle quintile’s income; the dollar amounts of these transfers tend to rise during recessions.[16]
According to a 2018 report by the Organization of Economic Cooperation and Development (OECD), the US has higher income inequality and a larger percentage of low income workers than almost any other advanced nation because unemployed and at-risk workers get less support from the government and a weak collective bargaining system.[113]
Effects
Economic
Income inequality may contribute to slower economic growth, reduced income mobility, higher levels of household debt, and greater risk of financial crises and deflation.[114][115]


While a 2000 survey of American Economic Association members found that only 53 percent disagreed with the statement that “The distribution of income and wealth has little, if any, impact on economic stability and growth”,[81] surveys from 2011 and 2020 found 73 percent and 78 percent disagreed respectively.[82][83]
Economic growth
Krueger wrote in 2012: “The rise in inequality in the United States over the last three decades has reached the point that inequality in incomes is causing an unhealthy division in opportunities, and is a threat to our economic growth. Restoring a greater degree of fairness to the U.S. job market would be good for businesses, good for the economy, and good for the country.” Since the wealthy tend to save nearly 50% of their marginal income while the remainder of the population saves roughly 10%, other things equal, this would reduce annual consumption (the largest component of GDP) by as much as 5%, but would increase investment, at least some of which would likely take place in the US. Krueger wrote that borrowing likely helped many households make up for this shift.[3]
Inequality in land and income ownership is negatively correlated with subsequent economic growth.[119] Increasing inequality harms growth in countries with high levels of urbanization.[120]
High unemployment rates have a significant negative effect[clarification needed] when interacting with increases in inequality. High unemployment also harms long-run economic growth. Unemployment may seriously harm growth because resources sit idle, because it generates redistributive pressures and distortions, because it idles human capital and deters its accumulation, because it drives people to poverty, because it results in liquidity constraints that limit labor mobility, and because it erodes individual self-esteem and promotes social dislocation, unrest, and conflict. Policies to control unemployment and reduce its inequality-associated effects can strengthen long-run growth.[121]
Economists such as David Moss, Krugman, and Raghuram Rajan believe the “Great Divergence” may be connected to the 2008 financial crisis.[122][123]
[124][125]