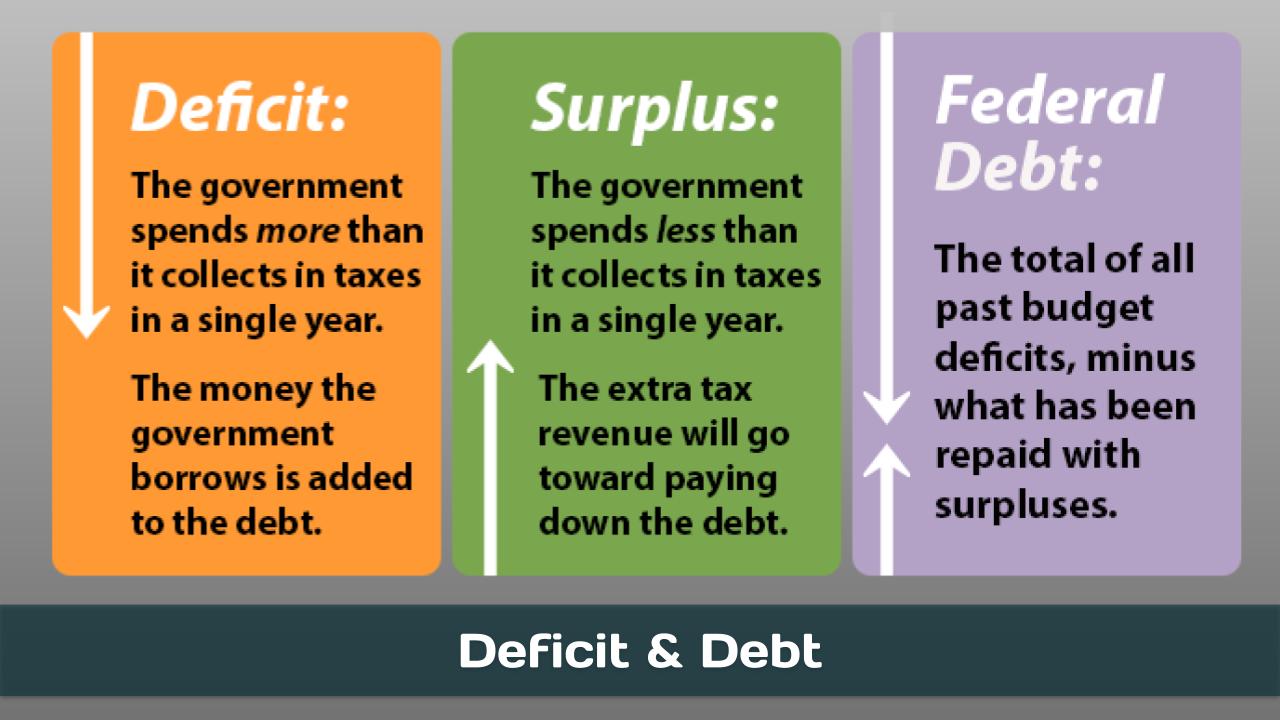
The national debt of the United States is the total national debt owed by the federal government of the United States to Treasury security holders. The national debt at any point in time is the face value of the then-outstanding Treasury securities that have been issued by the Treasury and other federal agencies. The terms “national deficit” and “national surplus” usually refer to the federal government budget balance from year to year, not the cumulative amount of debt. In a deficit year the national debt increases as the government needs to borrow funds to finance the deficit, while in a surplus year the debt decreases as more money is received than spent, enabling the government to reduce the debt by buying back some Treasury securities.
- In the ‘About’ section of this post is an overview of the issues or challenges, potential solutions, and web links. Other sections have information on relevant legislation, committees, agencies, programs in addition to information on the judiciary, nonpartisan & partisan organizations, and a wikipedia entry.
- bTo participate in ongoing forums, ask the post’s curators questions, and make suggestions, scroll to the ‘Discuss’ section at the bottom of each post or select the “comment” icon.
The Deficit & Debt category has related posts on government agencies and departments and committees and their Chairs.
23/05/2023 (05:43)
https://www.youtube.com/watch?v=WaXSRhOBV9Y
If you stacked up the full debt of the United States in hundred dollar bills, you could make not one, not two, but 13 piles of cash as tall as the Washington Monument. Lisa Desjardins takes a look at what the nation owes and has the latest on the debt ceiling negotiations on Capitol Hill.
OnAir Post: Deficit & Debt